
“Welcome to Upgrade2Python, your go-to channel for mastering Python programming! Whether you’re a beginner taking your first steps into the world of coding or an experienced programmer looking to level up your skills, Upgrade2Python is here to help you succeed.
Join us as we explore the ins and outs of Python, from basic syntax to advanced techniques. Our tutorials are designed to be clear, concise, and easy to follow, making learning Python fun and accessible for everyone.
Stay tuned for regular updates and new content designed to help you upgrade your Python skills and reach your programming goals. Subscribe now and let’s upgrade to Python together!”
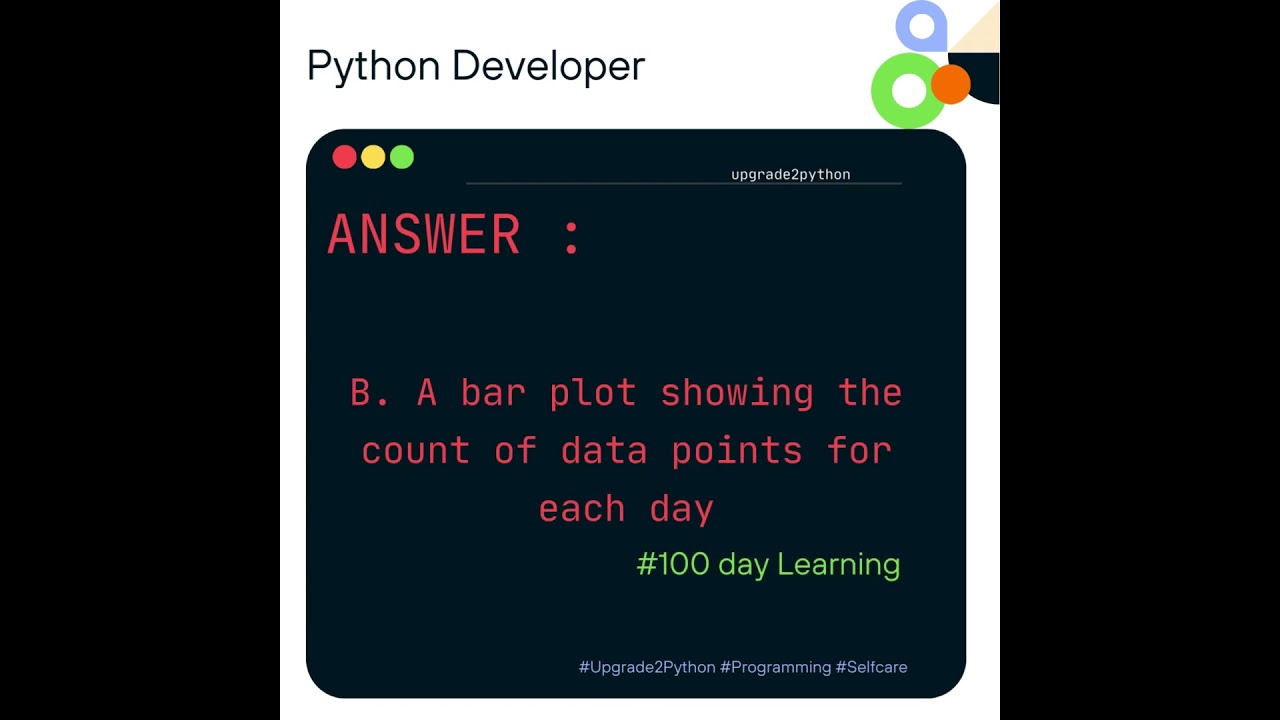
Answer: B) A bar plot showing the count of data points for each day
Explanation: The sns.countplot() function in Seaborn creates a bar plot that shows the count of data points for each category of a categorical variable. In this case, it will create a bar plot with the count of data points for each day of the week.
#samsung #shorts #reels #india #usa #unitedstates #function #facebookreels #youtubeshorts #youtube #youtubevideo #reel
#google #googleinterview #googleplay #microsoft #microsoftinterview
#jpmorgan #jp #python #Upgrade2Python #upgrade2python #facebook #facebookreels #upgrade2python #facebookreels #pythontutorial #u2p
コメント