
今回は、matplotlib、JupyterLabを使って、JSONデータからグラフをプロットに挑戦します。
さあ、Pythonを勉強しましょう。初心者のための動画です。
今回は、matplotlib、JupyterLabを使って、JSONデータからグラフをプロットに挑戦します。
Now, let’s study Python. It is a video for beginners.
This time, I will try to plot graphs from JSON data using matplotlib and JupyterLab.
こちらがmatplotlibの公式サイトです。
This is the official website of matplotlib.
matplotlibはpipを使って、インストール済みです。
Matplotlib is installed using pip.
matplotlibサンプルをベースとしてプログラムをしましょう。
Let’s program based on the matplotlib sample.
「examples」をクリックします。
Click “examples”.
「Plotting categonical variables」をクリックします。
Click “Plotting categonical variables”.
こちらのプログラムをベースとします。
Based on this program.
プログラムをコピーします。
Copy the program.
JupyterLabにペーストします。
Paste into JupyterLab.
実行します。
Run it.
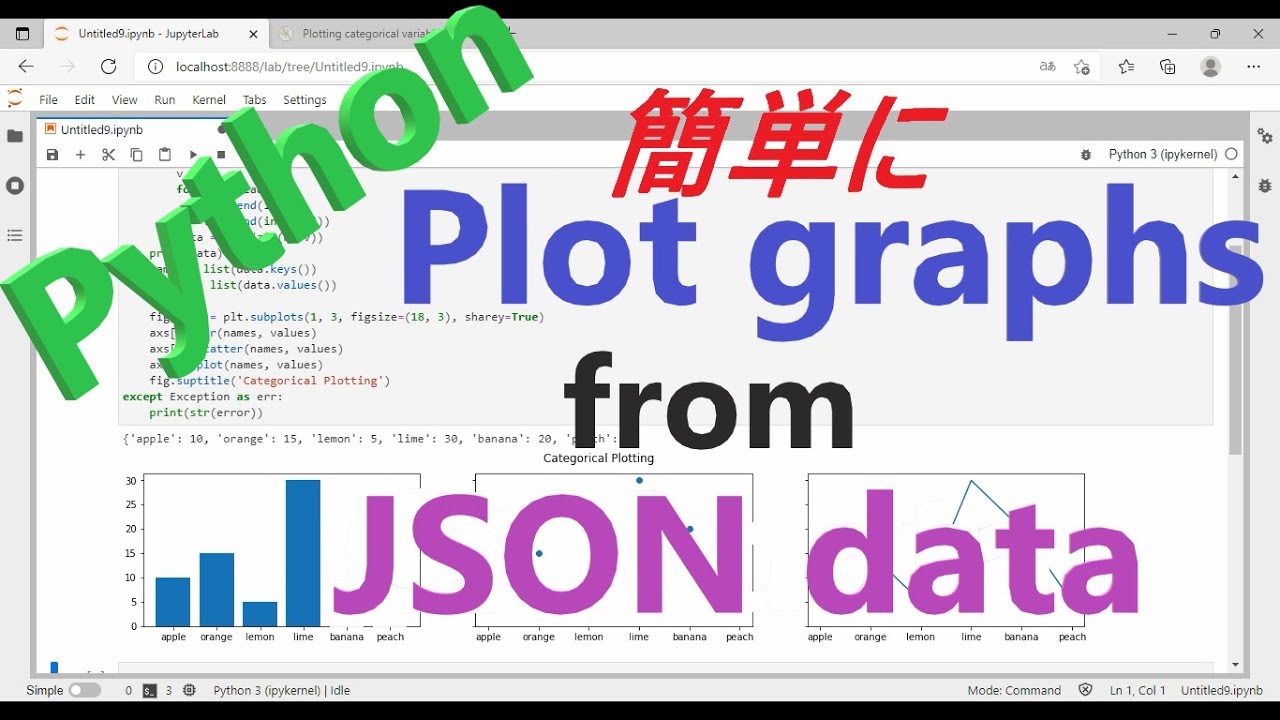
3種類のグラフたちが表示されました。
Three types of graphs were displayed.
jsonライブラリをimportします。
Import the json library.
「data」の行をコピーし、次に、コメントアウトします。
Copy the “data” line and then comment out.
エディタを開きます。今回はNotepadを使います。
Open the editor. This time, I will use Notepad.
「data」をペーストします。
Paste “data”.
「data =」を削除し、保存します。
Delete “data =” and save the file.
今回は、「fruit.json」と入力して、保存します。
This time, type “fruit.json” and save it.
まずは、JSONデータ「fruit.json」を読み込みます。
First, load the JSON data “fruit.json”.
実行します。
Run it.
エラーが発生しました。
An error occurred.
「,」を追加し、実行します。
Add “,” and run it.
エラーが発生しました。
An error occurred.
fruit.json を開きます。
Open “fruit.json”.
「’」を「”」に変更し、保存します。
Change ‘ to ” and save the file.
実行します。
Run it.
グラフが更新されました。
The graph has been updated.
私は、JSONデータからグラフをプロットすることに成功しました。
I succeeded in plotting graphs from JSON data.
JSONデータにデータを追加してみましょう。
Let’s add data to JSON data.
バナナ、ももを追加します。
Add “banana” and “peach”.
実行します。グラフが更新されました。
Run it. The graph has been updated.
バナナ、ももが追加されました。
“Banana” and “Peach” have been added.
x軸の幅を広げます。
Increase the width of the x-axis.
実行します。グラフが更新されました。
Run it. The graph has been updated.
私は、簡単に、JSONデータからグラフをプロットに成功しました。
I easily succeeded in plotting graphs from JSON data.
「data」の型を確認しましょう。
Let’s check the type of “data”.
実行します。
Run it.
「data」の型は、「dict」です。
The type of “data” is “dict”.
#スタディ
#ラーニング
#パイソン
#ジュピターラボ
#ジュパイターラボ
#ウインドウズ
#チャート
#ジェイソン
#matplotlib
#JupyterLab
#plot
#chart
#graph
#python
#json
#beginner
#dict


コメント